InfluxDB & Python
This post is part of the Sensor-to-Public-Web Pipeline series.
- Telegraf, MQTT & InfluxDB
- InfluxDB & Python
I’m still tinkering with my sensor-to-public-web pipeline (part 1 here). It’s current iteration uses the official InfluxDB Python client to query the database, select a subset of the data and save to a json file for later consumption. Below are some details regarding setting up this script.
Table of Contents
Overview #
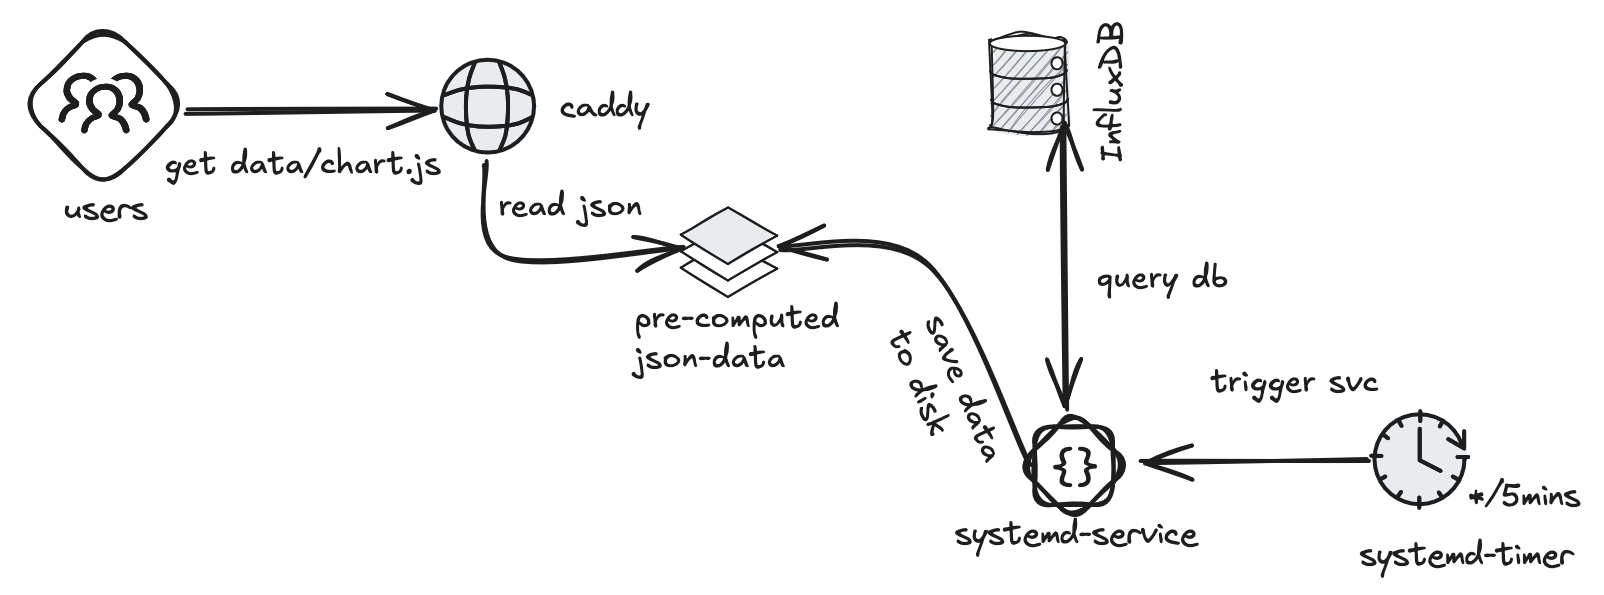
At first I thought I should just create a public, unauthenticated Grafana dashboard and serve that to my users. Then I started thinking about caching data returned from InfluxDB (to avoid getting owned by script kiddies)…and then I just decided to use a cronjob to generate the interesting data and save to a file, and serve that and use chart.js for drawing a graph from said data.

- a systemd timer triggers a systemd service every 5 minutes
- systemd service queries the InfluxDB database and saves the data to a JSON file
- Caddy is configured to serve said file as a static asset
- Visitors gets served a chart.js based visualization, which fetches the pre-computed json data file
Setup pipeline #
I’ve written an Ansible role for setting this up on a RedHat/CentOS host, but the steps are the same as below.
Packages #
On CentOS it seems that python3 and python3-venv are installed by default, so no dependencies for the client part of this setup. We will use Caddy for serving the web page later on, but that is technically optional.
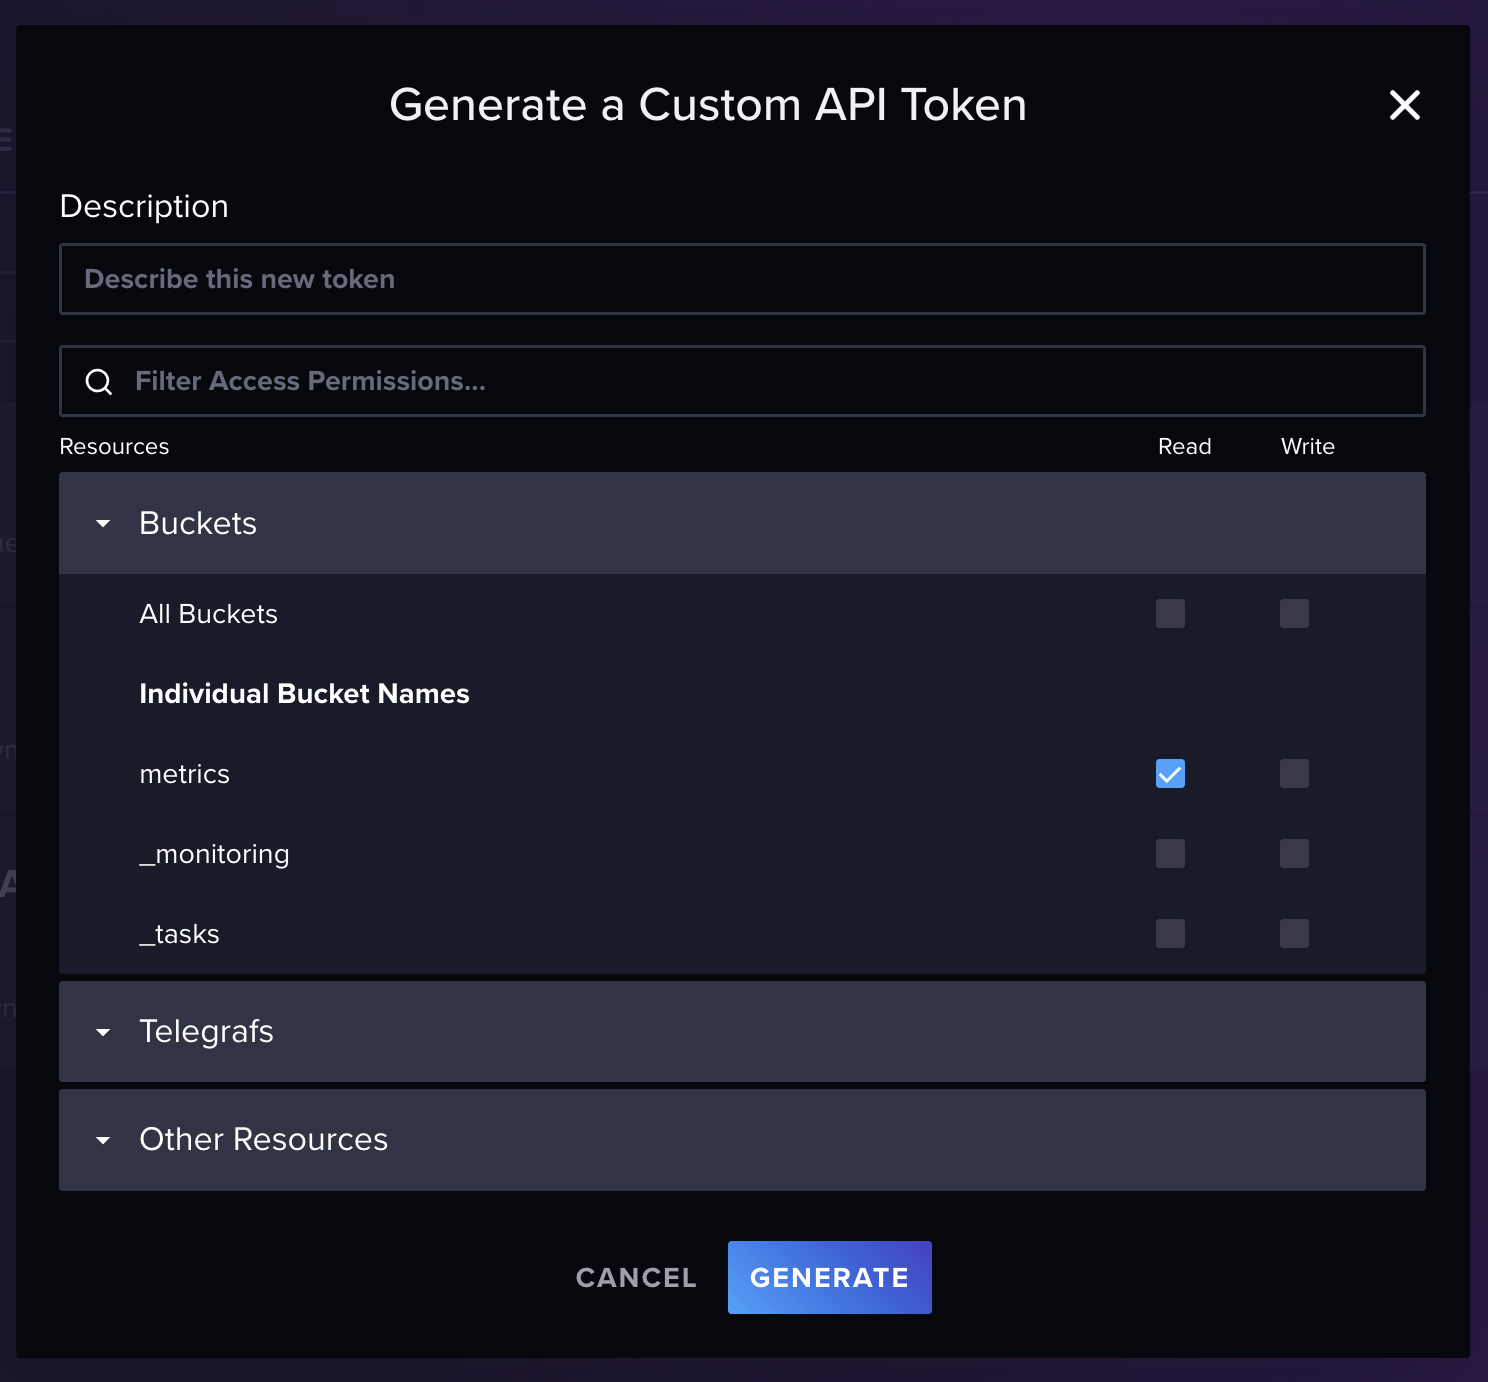
Generate read-only token #
Visit the InfluxDB administration interface (typically running at
http://localhost:8086) and create a new custom API token.

Save this token somewhere temporarily, we will write it to file on the server later on (in this section below).
Service user & group #
groupadd -r influxclient
useradd -r -m -d /var/lib/influxclient
Virtual environment #
First thing is to setup a virtual environment and install the InfluxDB client:
sudo -u influxclient -i bash
python -m venv venv
source venv/bin/activate
pip install influxdb-client
For development I just ran the above as my normal user. Later on I will setup the same thing for the user running the service.
The script #
I based/stole below from this InfluxDB tutorial, and just explored my data and tuned the query until I got the data I needed. Feel free to steal the it, but tune the query for your setup!
Save this as /var/lib/influxclient/query.py:
#!/usr/bin/env python

import os

from influxdb_client import InfluxDBClient

org = "MYORGHERE"
bucket = "metrics"
url = "http://localhost:8086"
path = "/srv/caddy/data"

# We will inject a secret as an environment variable using the systemd service
# definition, you might want to do something similar with org/bucket/url
token = os.environ.get("TOKEN")

# Note that I'm filtering on a few IDs as these are interesting for me, I don't
# want to plot irrelevant data points
query = """
from(bucket: "metrics")
  |> range(start: -24h)
  |> filter(fn: (r) => r["id"] == "34" or r["id"] == "92" or r["id"] == "161" or r["id"] == "130")
  |> filter(fn: (r) => r["model"] == "Bresser-3CH")
  |> filter(fn: (r) => r["_field"] == "temperature_C")
  |> filter(fn: (r) => r["_measurement"] == "mqtt_consumer")
  |> yield(name: "last")
"""

client = InfluxDBClient(url=url, token=token, org=org)

query_api = client.query_api()
results = client.query_api().query(org=org, query=query)

# Reduce the number of columns in our output, and transform it into JSON
output = results.to_json(columns=["device_id", "_value", "_time"], indent=2)

# Just dump the data to a file Caddy will serve from
with open(f"{path}/temperature_C.json", "w") as f:
    f.write(output)
Storing data #
The script will try to write data to
/srv/caddy/data/temperature_C.json, and Caddy will try to serve data
from /srv/caddy, so we have to make sure said directory exists and
that everyone has the necessary access:
mkdir -p /srv/caddy/data
chown caddy:influxclient /srv/caddy
chown influxclient:influxclient /srv/caddy/data
chmod 755 /srv/caddy/data
chmod 775 /srv/caddy
tmpfs #
This is optional! I’ve created a tmpfs to store my JSON data
in, as the data can be regenerated without effort and to avoid some
unnecessary drive writes.
You have to know the UID and GID for the owners of the folder. You can find these values like so:
$ id influxclient
uid=1234(influxclient) gid=1234(influxclient) groups=1234(influxclient)
Add this to the bottom of your /etc/fstab:
tmpfs /srv/caddy/data tmpfs nodev,nosuid,uid=1234,gid=1234,size=16M 0 0
(my data is currently 50KB so 16MB is overkill)
systemd service & timer #
Save both files to /etc/systemd/system named
influxdb-query.service & influxdb-query.timer respectively.
Service definition:
[Unit]
Description=Run queries against influxdb
After=network.target

[Service]
Type=oneshot
User=influxclient
EnvironmentFile=/var/lib/influxclient/.env
ExecStart=/var/lib/influxclient/venv/bin/python /var/lib/influxclient/query.py

[Install]
WantedBy=multi-user.target
Timer definition:
[Unit]
Description=Run queries against influxdb

[Timer]
Unit=influxdb-query.service
OnBootSec=3min
OnUnitActiveSec=5min

[Install]
WantedBy=timers.target
secrets #
Create a file as /var/lib/influxclient/.env and change below to your
needs:
TOKEN="YOUR-READ-ONLY-TOKEN-FROM-INFLUXDB"
This will be sourced by the systemd service, and the script will read the environment variable to use as a login token for InfluxDB.
Using ChatGPT to avoid learning javascript/chart.js #
I know I’m late for the party, but I finally decided to test ChatGPT for writing simple code – and it went surprisingly well!
I still know nothing of using ChartJS and JS…
Save below to /srv/caddy/index.html:
<!DOCTYPE html>
<html lang="sv">
<head>
    <meta charset="UTF-8">
    <meta name="viewport" content="width=device-width, initial-scale=1.0">
    <title>Temperaturgraf</title>
    <script src="https://cdn.jsdelivr.net/npm/chart.js"></script>
    <script src="https://cdn.jsdelivr.net/npm/chartjs-adapter-date-fns"></script>
    <style>
        body {
            margin: 0;
            padding: 0;
            display: flex;
            justify-content: center;
            align-items: center;
            height: 100vh;
            background-color: #f4f4f4;
        }

        canvas {
            max-width: 100%;
            height: auto;
        }

        @media (max-width: 600px) {
            canvas {
                width: 90%;
            }
        }
    </style>
</head>
<body>
    <canvas id="temperatureChart" width="400" height="200"></canvas>

    <script>
        fetch('https://sub.example.com/data/temperature_C.json') // Hämta JSON-data
            .then(response => response.json())
            .then(data => {
                const datasets = {};

                // Mappning av device_id till beskrivande namn och färger
                const deviceLabels = {
                    "161": { label: "Utomhus, öst", color: 'rgba(255, 99, 132, 1)' },
                    "130": { label: "Utomhus, norr", color: 'rgba(75, 192, 192, 1)' },
                    "34": { label: "Attefallare", color: 'rgba(54, 162, 235, 1)' },
                    "92": { label: "Pumphus", color: 'rgba(245, 40, 145, 1)' }
                };

                // Bearbeta data och dela upp efter device_id
                data.forEach(entry => {
                    const time = new Date(entry._time); // Omvandla till Date-objekt
                    const deviceId = entry.device_id;

                    // Hämta beskrivande namn och färg för device_id
                    const { label, color } = deviceLabels[deviceId] || { label: `Device ${deviceId}`, color: 'rgba(0, 0, 0, 1)' };

                    // Skapa dataset för varje device_id
                    if (!datasets[deviceId]) {
                        datasets[deviceId] = {
                            label: label,
                            data: [],
                            borderColor: color, // Använd den specifika färgen
                            fill: false
                        };
                    }

                    // Lägg till datapunkten i datasetet
                    datasets[deviceId].data.push({ x: time, y: entry._value });
                });

                // Omvandla datasets till en array
                const chartDatasets = Object.values(datasets);

                // Skapa grafen
                const ctx = document.getElementById('temperatureChart').getContext('2d');
                new Chart(ctx, {
                    type: 'line',
                    data: {
                        datasets: chartDatasets
                    },
                    options: {
                        responsive: true,
                        plugins: {
                            title: {
                                display: true,
                                text: 'Temperaturmätningar 24h', // Sätt grafens titel här
                                font: {
                                    size: 16 // Justera storlek på titeln
                                }
                            },
                            legend: {
                                display: true,
                                position: 'top'
                            }
                        },
                        scales: {
                            x: {
                                type: 'time', // Ställ in x-axeln som tid
                                title: {
                                    display: true,
                                    text: 'Tid'
                                },
                                time: {
                                    unit: 'minute', // Justera enheten för tidsaxeln
                                    tooltipFormat: 'HH:mm', // Format för tooltip
                                    displayFormats: {
                                        minute: 'HH:mm' // Format för x-axeln
                                    }
                                },
                                ticks: {
                                    callback: function(value) {
                                        const date = new Date(value);
                                        return date.toLocaleTimeString('sv-SE', { hour: '2-digit', minute: '2-digit' });
                                    }
                                }
                            },
                            y: {
                                title: {
                                    display: true,
                                    text: 'Temperatur'
                                }
                            }
                        }
                    }
                });
            })
            .catch(error => {
                console.error('Det gick inte att hämta JSON-filen:', error);
            });
    </script>
</body>
</html>
It’s all in Swedish, and I’m sure someone who knows JS will laugh from seeing the above…but it will do. :-)
Caddy #
Now I’m just serving this using a subdomain, where my
temperature_C.json is served from /data/temperature_C.json. My
Caddyfile looks something like this:
sub.example.com {
    root * /srv/caddy
    file_server
}
File system layout of /srv/caddy:
.
├── data
│   └── temperature_C.json
└── index.html
Conclusion #
Is this overengineered? Probably.
Is it stable and reliable? Kinda.
Did I avoid learning JavaScript? Yes!